Understanding how blasting media degrades over time is the difference between a controlled process and a reactive one. For reliability engineers, the abrasive b...
Published
14 Feb 2015
Category
Abrasives
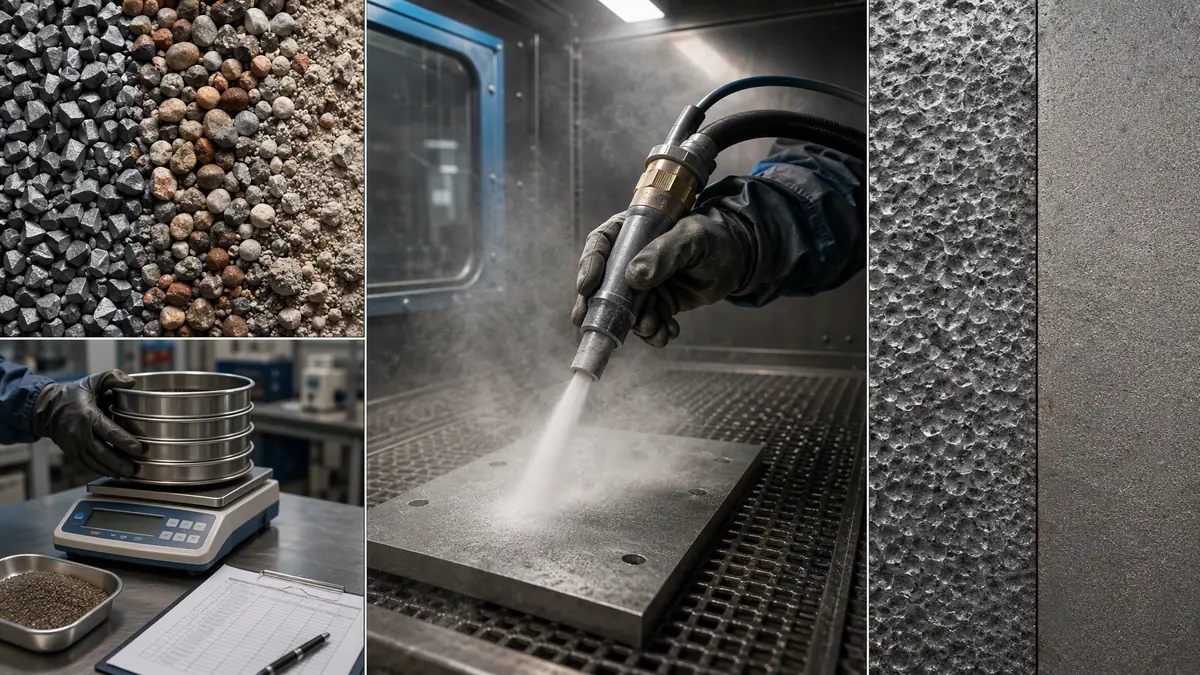
FIG. 01A visual breakdown of the abrasive lifecyc...
A professional multi-panel editorial image for an article on predicting abrasive replacement intervals. The collage features a dominant blast cabinet operation, a macro close-up of degrading abrasive particles, a sieve analysis setup in a lab, and a comparison of surface profiles created by fresh ve
01 Introduction
Understanding how blasting media degrades over time is the difference between a controlled process and a reactive one. For reliability engineers, the abrasive breakdown rate directly governs surface finish consistency, operating cost, and unschedule…
02 Introduction
Abrasive particles fracture and round upon impact, generating fines that change the media's effective size distribution.
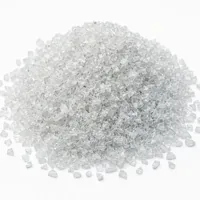
A detailed macro view inside a blasting cabinet showing the moment abrasive particles strike a steel surface. The image captures particle fracture and the accumulation of rounded media and dust, visually defining the progressive degradation that drives the abrasive breakdown curve.
Every time abrasive particles strike a work surface, they change. Edges round, particles fracture, and fines accumulate. This progressive degradation—not simply media consumption—determines when a blast system stops performing to specification. Reliability engineers who track this breakdown curve can predict replacement intervals with enough lead time to avoid emergency top-ups, maintain profile consistency, and reduce total abrasive cost. This article explains how abrasive breakdown curves work, what drives the rate of size decay, and how to use that understanding to move from reactive media management to planned replenishment.
03 What Is an Abrasive Breakdown Curve?
A sieve analysis plots the shift in particle size distribution over time, forming the basis of the breakdown curve.
An industrial scene showing a sieve analysis being conducted on a sample of blasting media. The image connects the physical test to the concept of a breakdown curve, which plots the changing particle size distribution against usage cycles.
An abrasive breakdown curve describes how a batch of blasting media loses its effective particle size distribution over successive cycles. It plots the shift in the media's sieve analysis—the proportion of particles retained on each mesh screen—against time, throughput, or number of blast cycles.
In fresh media, particle size distribution is tightly controlled. As blasting proceeds, three things happen simultaneously:
Fracture: Particles split into smaller, angular fragments upon impact. This is the primary mechanism for friable media like garnet, aluminum oxide, and mineral slags.
Rounding (attrition): Edges and corners wear away through abrasion, producing rounded particles that cut less aggressively. This dominates in metallic media like steel shot.
Fines generation: The smallest fragments and dust accumulate, reducing the effective working fraction of the media mix.
The breakdown curve captures the rate at which the working fraction of media—the particle sizes actually doing useful work—disappears and is replaced by undersized particles and dust. A steep curve means rapid degradation; a shallow curve indicates longer media life.
Why the Curve Matters
Blast cleaning specifications typically require a specific surface profile (anchor pattern) and cleanliness level. Both depend on particle size, shape, and velocity. As media breaks down:
Average particle size decreases, reducing impact energy per particle.
Angularity may temporarily increase (fresh fractures) before declining (rounding).
Dust loading rises, impairing visibility in cabinets and increasing dust collector load.
Coverage rate—square meters blasted per hour—drops.
When the working fraction falls below a threshold, the operator compensates by increasing blast pressure or dwell time, raising energy cost and risking substrate damage. The breakdown curve helps identify that threshold before quality suffers.
04 How Abrasive Breakdown Works: Fracture, Size Decay, and Media Life
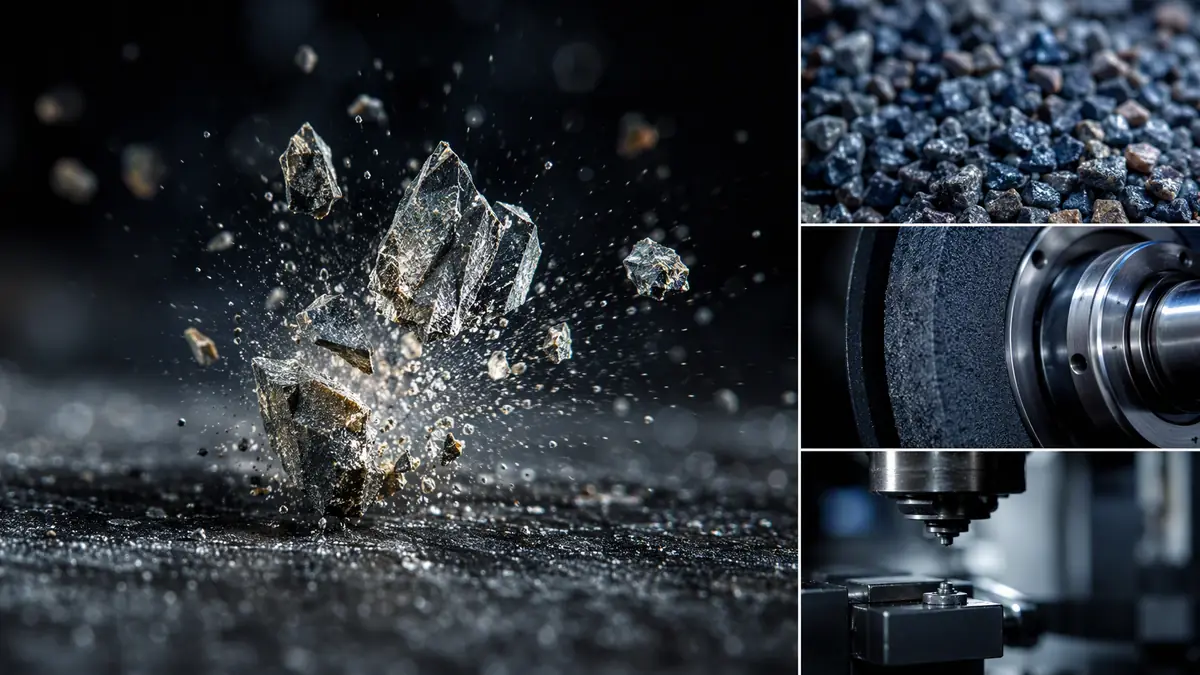
Fracture is the dominant breakdown mode, where impact stress exceeds the particle's toughness, creating smaller fragments.
A high-speed macro photograph capturing the precise moment of abrasive particle fracture. The image shows a single particle shattering into multiple sharp fragments upon impact, illustrating the primary mechanism of size decay in friable media like garnet and aluminum oxide.
Fracture Mechanisms
Fracture is the dominant breakdown mode for mineral and ceramic abrasives. When a particle hits a hard surface at 60–100 psi, the impact stress can exceed its fracture toughness. The particle shatters, producing several smaller fragments with fresh sharp edges.
The fracture rate depends on:
Media toughness: Tougher materials (steel grit, certain garnets) resist fracture better than brittle ones (coal slag, some aluminum oxides).
Impact velocity: Higher blast pressure increases impact energy and fracture probability.
Target hardness: Blasting harder substrates accelerates media breakdown.
Impact angle: Near-perpendicular impacts cause more fracture than oblique angles.
Size Decay and the Working Fraction
Size decay is the progressive shift of the particle size distribution toward finer sizes. In a recycling blast system (blast cabinet, shot blast machine, or recovery-equipped open blasting), the same media passes through the system multiple times. Each cycle shifts the distribution.
A typical breakdown curve for a friable abrasive shows:
Initial conditioning (cycles 1–3): Oversized or weakly bonded particles break quickly. The curve drops moderately.
Steady-state working range (cycles 4–15): Fracture rate stabilizes. The working fraction declines at a relatively constant rate. This is the productive life of the media.
Accelerated decay (cycles 15+): The proportion of small, worn particles becomes self-reinforcing—they cushion impacts on remaining larger particles, but also fail to do useful work. Dust loading spikes, and the operator sees rapid performance loss.
For metallic media like steel shot, the curve looks different. Shot work-hardens on impact, becoming more resistant to fracture. The primary degradation is spalling and gradual size reduction through fatigue. Steel shot breakdown curves are typically much shallower than those for mineral abrasives, with media life measured in hundreds or thousands of cycles.
Media Life Prediction
Media life prediction is the practice of forecasting when a working media charge will fall below the acceptable particle size distribution. It combines:
The breakdown curve for the specific media and application.
The minimum acceptable working fraction (defined by the surface profile specification).
The replenishment strategy (continuous top-up versus batch replacement).
In practice, reliability engineers establish a baseline by sieving media samples at regular intervals—for example, every four hours of blast time—and plotting the percentage retained on the critical mesh size. Once the trend is established, replacement can be scheduled before the media crosses the performance threshold.
05 When Breakdown Curves Are Useful—and When They Are Not
Breakdown curves are vital for recycling systems but academic for single-pass, expendable abrasive operations.
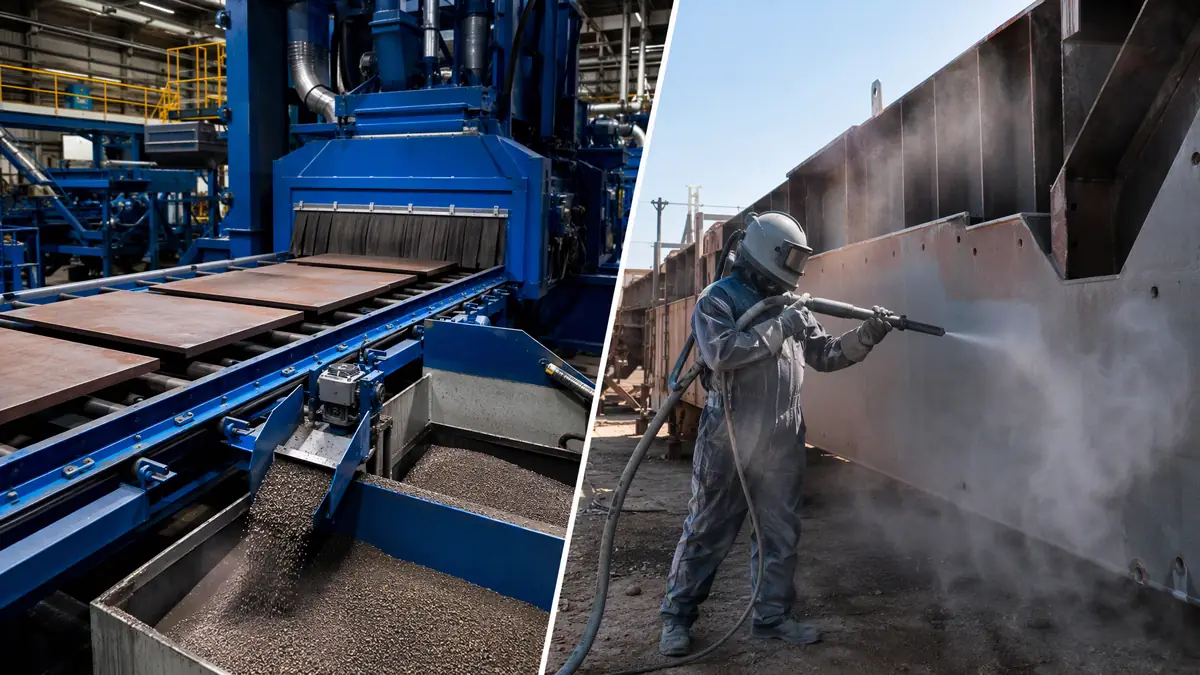
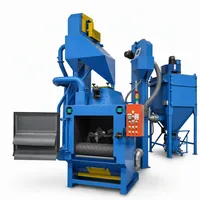
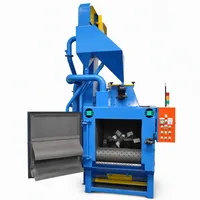
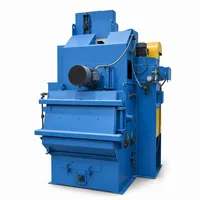
A comparative industrial image showing a controlled, recycling shot blast machine on one side and an open-field, single-pass blasting operation on the other. This visual contrasts the applications where breakdown curve analysis is practical versus where it is not.
Suitable Applications
Breakdown curve analysis is most valuable in:
Recycling blast systems: Cabinets, shot blast machines, and any setup with media recovery and reuse. Single-pass blasting (common in open-field blasting with expendable abrasives) generates a breakdown curve only as an academic exercise—the media is not reused.
Critical surface preparation: Applications where profile depth and consistency are contractually specified, such as pipeline coating, marine hull blasting to SA 2.5, or aerospace component preparation.
High-consumption operations: Facilities spending significantly on abrasive media where a 15–20% reduction in media cost through optimized replacement intervals yields meaningful savings.
Automated or semi-automated lines: Where process consistency directly affects downstream coating adhesion and rework rates.
Where Breakdown Curves Offer Less Value
Single-pass, expendable abrasive blasting: The media is used once. The breakdown curve is irrelevant to replacement decisions, though understanding fracture behavior still helps with nozzle distance and pressure settings.
Operations with highly variable workpieces: If the substrate hardness, geometry, and required profile change frequently, a single breakdown curve may not apply. Multiple curves or a wider safety margin are needed.
Very low-utilization systems: If a blast cabinet runs a few hours per month, the cost of sieving and tracking may exceed the savings from optimized replacement.
06 Factors That Influence the Abrasive Breakdown Rate
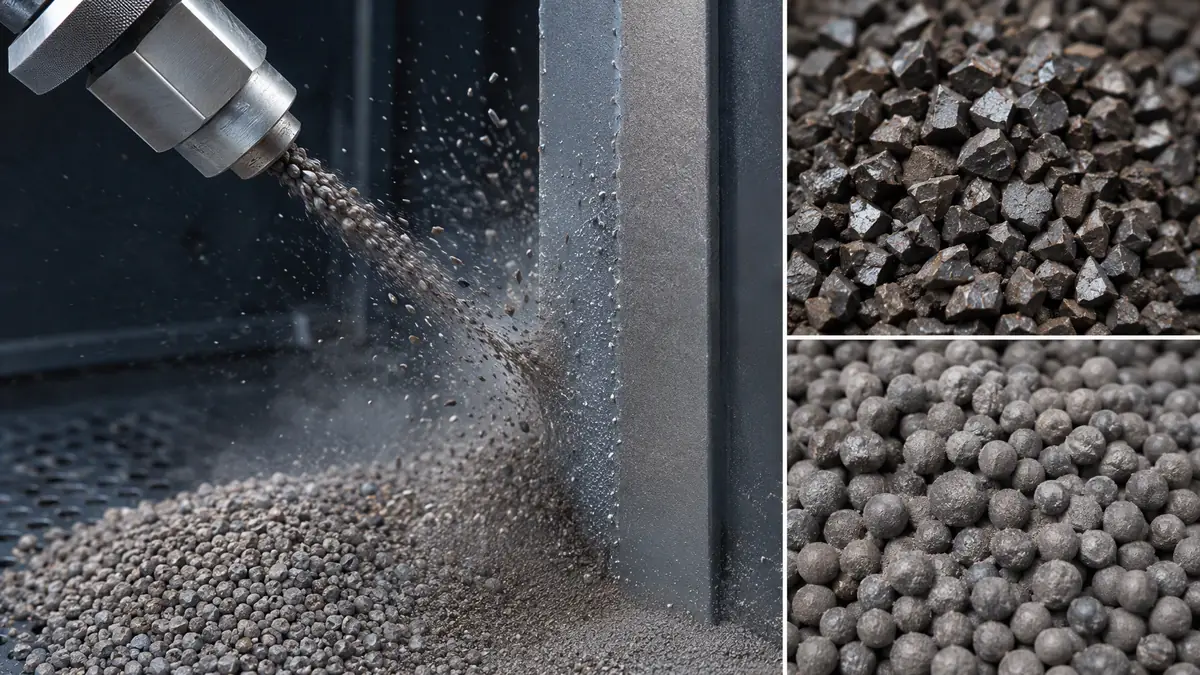
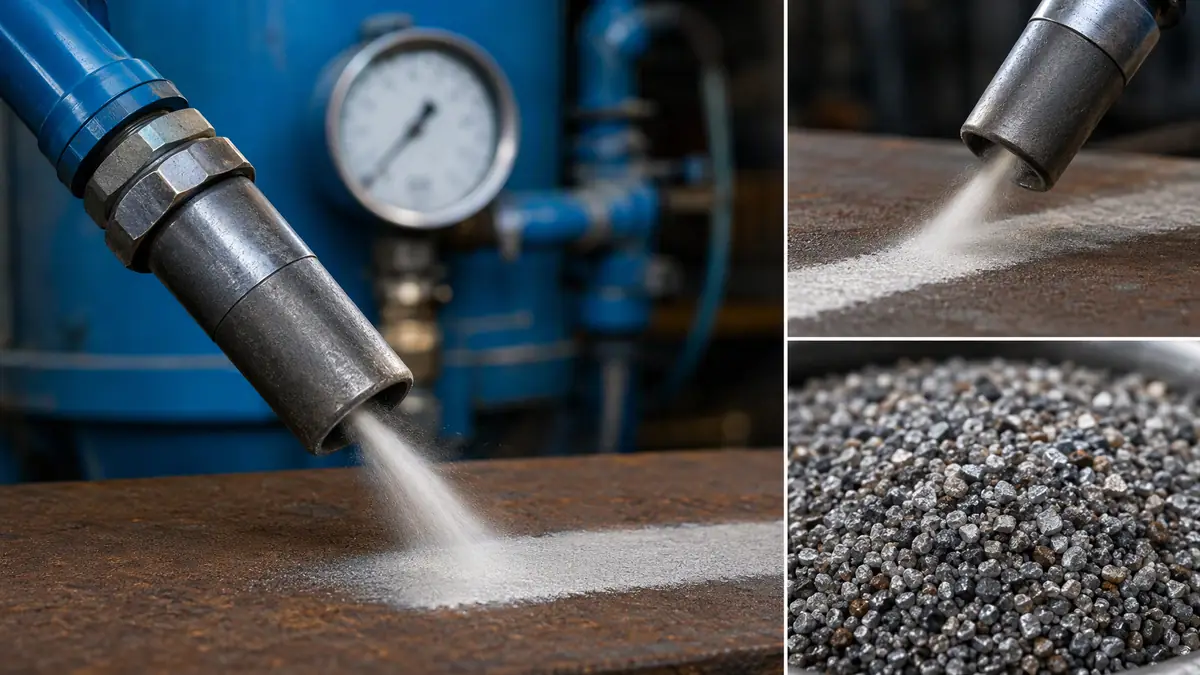
Operating parameters like blast pressure, nozzle type, and impact angle directly control the abrasive fracture rate.
A detailed industrial photograph focusing on a Venturi blast nozzle positioned at a 45-degree impact angle against steel. The image highlights key factors influencing breakdown rate, with a background pressure gauge subtly reinforcing the concept of controlled operating parameters.
Understanding what accelerates or slows breakdown helps engineers select media and set operating parameters that extend media life.
Replace nozzles before the orifice enlarges beyond 10–15% of original
Impact angle
90° impacts maximize fracture; 30–45° reduces it
Adjust angle for cleaning efficiency without excessive media damage
Substrate hardness
Harder targets accelerate media breakdown
Blasting hardened steel wears media faster than blasting mild steel
Media replenishment rate
Continuous top-up maintains working fraction; batch replacement allows wider distribution drift
Continuous replenishment with sieving yields the most consistent results
Contamination
Moisture, oil, or coarse debris alter fracture behavior
Maintain air dryers and keep virgin media clean
07 How to Build and Use a Breakdown Curve: A Practical Approach
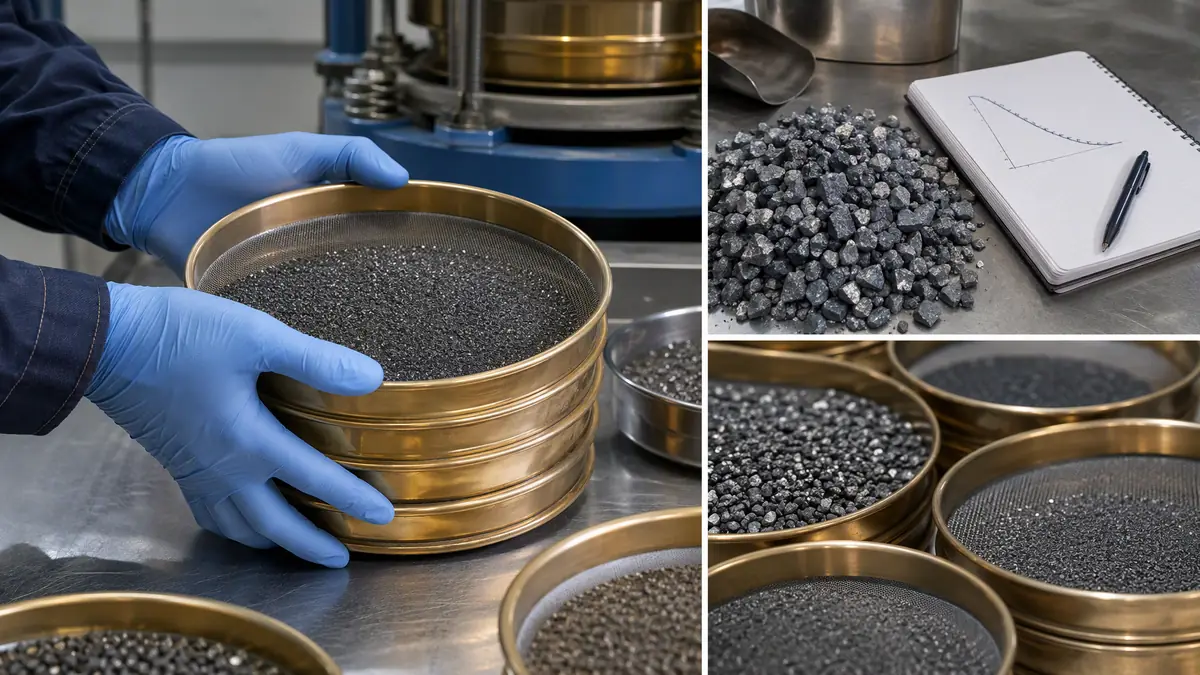
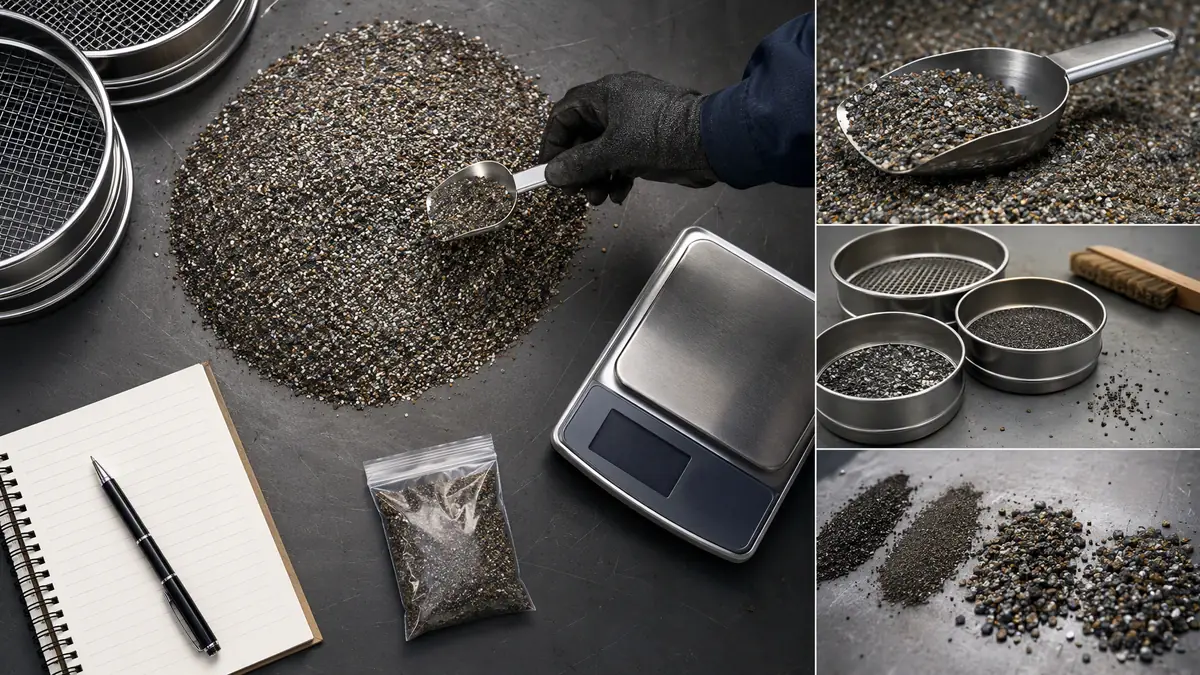
Building a breakdown curve starts with taking a representative sample and running a sieve analysis to establish a baseline.
A methodical flat-lay photograph of the tools needed to build an abrasive breakdown curve. The image includes a scoop taking a media sample, a digital scale, a sieve stack, and a notepad, visually representing the practical, step-by-step approach a reliability engineer would take.
For a reliability engineer managing a recycling blast system, the process is straightforward and does not require specialized laboratory equipment beyond what a quality-control lab typically has.
Step 1: Define the Critical Mesh Size
Determine the smallest particle size that still produces the required surface profile. This is typically the mesh size below which profile depth drops below specification. For example, if a 36-mesh garnet produces a 75-micron profile but 54-mesh and finer does not, the working fraction is everything retained on a 54-mesh screen.
Step 2: Establish the Baseline
With a fresh media charge, take a representative sample (200–300 grams) and run a sieve analysis. Record the percentage retained on each mesh size. This is the zero-cycle reference point.
Step 3: Sample at Regular Intervals
After every fixed period of blast operation—say, four hours of trigger time—collect a sample from the media stream (not from the dust collector). Sieve and record the percentage retained on the critical mesh size. Plot these values against cumulative blast time or cycle count.
Step 4: Identify the Replacement Threshold
The replacement threshold is the point where the working fraction drops below the level needed for consistent profile. This is not necessarily zero—many systems operate acceptably with 60–70% working fraction if fines are being removed by the dust collector and the operator adjusts feed rate.
The threshold is confirmed by correlating sieve data with surface profile measurements. When profile drops below the lower specification limit, note the corresponding working fraction percentage. That becomes the trigger for replacement or major replenishment.
Step 5: Predict and Schedule
Once the curve is established over several media change-out cycles, the slope of the working-fraction decline becomes predictable. If the working fraction drops from 95% to 65% over 20 hours of blast time, the replacement interval is approximately 20 hours. Schedule media change-out at 18–19 hours to maintain a safety margin.
08 Common Mistakes When Interpreting Breakdown Curves
Mistaking dust collector fines for working media loss. A dust collector removing fines is a good thing—it pulls out non-working particles. Do not assume all media loss is degradation; some is necessary separation. Track what the dust collector removes separately.
Ignoring the effect of continuous replenishment. Many systems add fresh media continuously through an automatic replenisher. This changes the shape of the breakdown curve entirely—the system reaches a steady-state distribution rather than a declining one. The curve becomes a tool for setting the replenishment rate, not the batch replacement interval.
Using the wrong sieve stack. A sieve analysis that skips the critical mesh sizes will miss the transition point. Ensure the sieve stack brackets the working-fraction threshold with at least two mesh sizes above and below it.
Assuming all media of the same type behaves identically. Two garnet abrasives from different sources can have different fracture toughness due to mineralogy and processing. Verify the breakdown curve for each new supplier or lot if the application is critical.
Overlooking nozzle wear. A worn nozzle reduces particle velocity, which can mask media degradation by reducing both cleaning rate and fracture rate simultaneously. The process appears stable until the nozzle is replaced, at which point the higher velocity suddenly accelerates breakdown of the aged media charge.
09 Moving from Reactive to Predictive Media Management
The operational benefit of understanding abrasive breakdown curves is predictability. When media replacement is reactive—triggered by operator complaint or visible quality issues—the operation has already experienced some period of substandard blasting. Rework, coating failures, and production delays accumulate before the problem is addressed.
A predictive approach using breakdown curves allows:
Scheduled media change-outs during planned downtime, not emergency stops.
Consistent surface profiles across shifts and operators.
Reduced abrasive consumption by avoiding premature replacement while preventing the inefficiency of blasting with spent media.
Better budgeting for abrasive media as a predictable consumable cost rather than a variable one.
For reliability engineers, the breakdown curve is a practical tool that connects media specification, operating parameters, and maintenance planning. It does not require continuous monitoring—once the curve is established for a given media, substrate, and pressure combination, the replacement interval becomes a known quantity that can be built into the preventive maintenance schedule.
10 Frequently Asked Questions
What exactly is an abrasive breakdown curve?
An abrasive breakdown curve is a graph that tracks how a batch of blasting media loses its effective particle size over time or through reuse cycles. It plots the shift in the media's sieve analysis, showing the rate at which usable, working particles fracture into smaller fragments and fines. This curve helps predict when the media will no longer meet surface profile specifications.
How do I know when to replace my blasting media based on the breakdown curve?
You determine the replacement threshold by identifying the smallest particle size that still achieves your required surface profile. By regularly sieving samples and plotting the percentage retained on that critical mesh size, you can see the trend. Schedule a full replacement or a major top-up just before the working fraction drops below the level needed for your specification.
Does the abrasive breakdown rate matter for single-pass blasting?
No, breakdown curve analysis is not directly useful for single-pass, expendable abrasive blasting because the media is not recovered and reused. The curve is a tool for managing media life in recycling systems. However, understanding fracture behavior can still help you optimize nozzle distance and blast pressure for maximum efficiency on a single use.
What is the biggest mistake when trying to extend media life?
The most common mistake is compensating for worn media by increasing blast pressure. This accelerates the fracture rate of the remaining good media, increases energy costs, and risks warping or damaging the substrate. A better approach is to maintain the working fraction through a consistent, scheduled replenishment strategy based on your breakdown curve.
How does the type of abrasive affect its breakdown curve?
Tougher materials like steel grit have a much shallower breakdown curve and can last for hundreds or thousands of cycles, primarily wearing through fatigue and spalling. Friable mineral abrasives like garnet or coal slag have a steeper curve, fracturing on impact to create new sharp edges but degrading to dust much more quickly.
What safety or maintenance issue is linked to a steep breakdown curve?
A steep breakdown curve leads to rapid fines generation, which increases dust loading in the system. This impairs operator visibility in cabinets, clogs dust collector filters more quickly, and can create a respiratory hazard if not properly controlled. Monitoring the curve helps you anticipate and manage these dust collection demands before they become a problem.
How do I start predicting my media replacement intervals?
Begin by establishing a baseline with a fresh media charge. Run a sieve analysis to record the particle size distribution, then collect and sieve a representative sample from the media stream at regular intervals, such as every four hours of blast time. Plot the percentage of working fraction against time to establish a trend, which will allow you to forecast the optimal replacement point.
11 Solution
If you are experiencing inconsistent surface profiles, rising abrasive consumption, or unplanned downtime for media change-out, the first step is to characterize your current breakdown curve. Run a sieve analysis on your working media at the start, middle, and end of a typical operating period. The data will show whether your replacement timing is too early, too late, or about right.
When you are ready to evaluate abrasive media options that offer a flatter breakdown curve and longer media life for your specific application, review the technical specifications of available abrasives. For confirmation of compatibility with your blast system and operating conditions, contact SPA2Z with your current media type, blast pressure, substrate material, and required surface profile—the team can help identify media with the toughness and size distribution to extend your predictable working interval.
12 Get a quote
Get a quote
Tell us what you need. We reply within one business day.